
NetGuard: A UX Case Study
1. Introduction
The 'NetGuard' project focuses on designing a comprehensive solution for IT Managers to monitor and manage their network infrastructure effectively. This project aims to provide IT Managers with real-time insights into network utilization, uptime, and cost management, enabling them to make informed decisions and respond quickly to potential issues. The solution is designed to be accessible both from a terminal in the office and on the go, ensuring that IT Managers can stay informed and take action regardless of their location.
My Role
As a Senior UX Designer for the 'NetGuard' project, my key responsibilities included:
- Collaborating with the UX Lead to execute the UX design process from initial research to final delivery.
- Conducting user research in collaboration with the UX research team.
- Defining user personas and mapping user tasks and flows.
- Creating wireframes and prototypes to visualize and iterate on design concepts.
- Iterating on the design based on insights gathered from usability testing.
- Collaborating with stakeholders, developers, and the UX Lead to align the design with both user needs and business goals.
- Providing support during the development phase to ensure the design was implemented as intended.
2. Background
Context and Business Goals
In today’s increasingly connected world, network infrastructure is the backbone of any organization’s IT operations. IT Managers are tasked with ensuring that these networks run smoothly, efficiently, and cost-effectively. However, with the complexity of modern networks—comprising multiple routers, switches, access points, and other critical components—monitoring and managing these networks can be a daunting challenge.
‘NetGuard’ was conceived to address these challenges by providing IT Managers with a centralized platform for monitoring and managing their networks. The primary business goal of this project was to develop a tool that not only simplifies the management of network resources but also provides actionable insights into network utilization, uptime, and cost. This tool was designed to support IT Managers in making informed decisions that can optimize network performance and reduce operational costs.
The business aimed to offer a solution that could be used seamlessly across different devices, allowing IT Managers to monitor network health and respond to incidents whether they are at their desks or on the move. Additionally, the project sought to strengthen the company’s market position by offering a robust, user-friendly network management solution that meets the needs of enterprise-level customers.
Challenges
The primary challenge was to create an intuitive, yet powerful interface that could handle the complexity of network management while remaining accessible to users who might not have deep technical expertise. Another challenge was to ensure that the solution was scalable and could handle the diverse needs of organizations of various sizes, from small businesses to large enterprises. The solution also needed to integrate smoothly with existing network infrastructure and provide real-time data and alerts to enable proactive management.
By addressing these challenges, ‘NetGuard’ aimed to empower IT Managers to maintain optimal network performance, minimize downtime, and effectively manage network-related costs.
3. Problem Statement
Challenges
IT Managers are responsible for maintaining the health, performance, and cost-efficiency of their organization’s network infrastructure. However, managing a network in today’s complex IT environments poses several challenges:
Complexity of Network Monitoring: With networks comprising numerous routers, switches, access points, and other critical components, IT Managers need to monitor a wide array of metrics, including utilization, uptime, and performance. The sheer volume of data and the complexity of these networks can make it difficult for IT Managers to gain a clear understanding of network health in real-time.
Cost Management: Network providers typically charge based on various factors such as routers, ports, connections, and usage over time. IT Managers need to have a detailed understanding of these costs to optimize network operations and reduce unnecessary expenditures. However, tracking these costs manually or through disparate systems can be inefficient and prone to errors.
Real-Time Access to Information: IT Managers often work from their office terminals but frequently need to move between meetings with executives who require quick updates on network health and business impacts. This mobility introduces the need for a solution that provides real-time, accessible insights into the network’s status, regardless of location.
Incident Management: When network issues arise, IT Managers need to quickly identify the problem, assess its impact, and take corrective action. Without an efficient way to monitor network status and respond to incidents, downtime can increase, leading to business disruptions.
Objectives
The ‘NetGuard’ project aims to address these challenges by developing a solution that enables IT Managers to:
Monitor Network Utilization and Health: Provide a clear, real-time overview of network performance metrics, including utilization, uptime, and latency, allowing IT Managers to quickly assess network health.
Optimize Cost Management: Offer detailed insights into network costs, broken down by routers, ports, connections, and other factors, to help IT Managers identify areas for cost savings and optimize their network operations.
Ensure Mobility and Accessibility: Design a responsive interface that IT Managers can access from both their office terminals and mobile devices, ensuring they can stay informed and manage their networks effectively, even while on the move.
Improve Incident Response: Integrate features that allow IT Managers to quickly detect, assess, and respond to network incidents, minimizing downtime and maintaining business continuity.
By meeting these objectives, ‘NetGuard’ will empower IT Managers to maintain optimal network performance, manage costs effectively, and respond to issues proactively, ultimately enhancing the efficiency and reliability of their organization’s network infrastructure.
4. Research
The research phase of the ‘NetGuard’ project was crucial in understanding the specific needs and challenges faced by IT Managers in managing their network infrastructure. This phase involved a combination of stakeholder interviews, surveys, competitive analysis, and user research to gather insights that would inform the design process.
Stakeholder Interviews
To gain a comprehensive understanding of the business objectives and technical requirements, we conducted interviews with key stakeholders, including IT directors, network engineers, and decision-makers within the organization. These interviews helped us identify the critical features that ‘NetGuard’ needed to include, such as real-time network monitoring, cost management, and incident response capabilities. The feedback from stakeholders also highlighted the importance of creating a solution that is both powerful and easy to use, ensuring adoption across different levels of technical expertise.
Surveys and Questionnaires
We distributed surveys and questionnaires to a broader audience of IT Managers across various industries. The goal was to gather quantitative data on the common challenges they face in network management, their current tools and processes, and the specific features they would find most valuable in a new solution. The survey results reinforced the need for a centralized platform that could provide real-time insights, simplify cost management, and offer mobility for IT Managers who are frequently on the move.
Competitive Analysis
A thorough competitive analysis was conducted to evaluate existing network management tools in the market. We analyzed the strengths and weaknesses of these tools, focusing on their user interfaces, feature sets, and overall user experience. This analysis provided valuable insights into industry standards and gaps in the market, allowing us to position ‘NetGuard’ as a more intuitive and comprehensive solution. We identified opportunities to improve on existing solutions by offering a more user-friendly interface, better cost management features, and enhanced mobile accessibility.
User Research
In collaboration with the UX research team, we conducted in-depth user research to explore the day-to-day tasks, pain points, and goals of IT Managers. This research involved one-on-one interviews, contextual inquiries, and observational studies. We observed IT Managers in their work environments, noting how they interacted with existing tools and what challenges they encountered. This research provided a deeper understanding of the user’s workflow, highlighting the need for features that support quick decision-making, real-time updates, and seamless transitions between different devices.
Personas
Based on the findings from our research, we developed detailed personas that represented the target users of ‘NetGuard.’ The primary persona, an IT Manager, was characterized by their need for real-time network insights, efficient cost management, and the ability to respond quickly to incidents. The personas also captured the varying levels of technical expertise among users, ensuring that ‘NetGuard’ would be accessible to both seasoned professionals and those newer to network management.
The research phase was instrumental in shaping the direction of the ‘NetGuard’ project, providing a solid foundation of user-centered insights that guided the design and development process. By thoroughly understanding the needs of IT Managers and analyzing the competitive landscape, we were able to define clear goals and design principles for ‘NetGuard’ that would ultimately result in a product that meets and exceeds user expectations.
IT Manager
Goals:
- Understand and monitor key details for each network.
- Focus on metrics such as network utilization, uptime, and cost.
Pain Points:
- Primarily works from a terminal in the office but often moves between meetings.
- Frequently asked by executives for quick updates on network health and business impacts.
5. Define
After completing the research phase, the next step was to synthesize the insights gathered and clearly define the user tasks, flows, and the overall information architecture for ‘NetGuard.’ This phase was crucial in translating research findings into actionable design strategies that would address the identified challenges and meet the objectives of the project.
User Tasks and Task Analysis
Based on the research findings, we identified the key tasks that IT Managers needed to perform within the ‘NetGuard’ platform. These tasks were broken down into specific actions that the user would take to achieve their goals, such as monitoring network health, managing costs, and responding to incidents. Each task was analyzed to understand the sequence of steps involved, potential pain points, and the desired outcomes. This analysis ensured that the design would support the IT Manager’s workflow in a logical and efficient manner.
Key user tasks included:
- Registration and Login: Ensuring secure and easy access to the platform.
- Manage Account: Customizing settings, alerts, and preferences to suit the IT Manager’s specific needs.
- Set Up and Manage Networks: Viewing and managing the entire network infrastructure, including LANs, routers, switches, and access points.
- Monitor Network Health: Accessing real-time data on network performance, identifying issues, and assessing their impact.
- Cost Management: Tracking network-related expenses and optimizing costs by analyzing detailed reports.
- Reports: Generating and managing detailed reports on network performance, costs, and usage trends.
Task Flow
With the key tasks defined, we created detailed task flows that mapped out the user’s journey through each task within ‘NetGuard.’ These task flows illustrated the step-by-step process that an IT Manager would follow to complete a specific task, such as setting up a new network or monitoring network traffic. The task flows were designed to be intuitive, minimizing the number of steps required and reducing cognitive load on the user.
For example:
- Login to Dashboard: The task flow starts with the user logging into the system, which leads them to the main dashboard where they can view an overview of network health and alerts.
- Monitor Network: From the dashboard, the user can access detailed monitoring tools, allowing them to drill down into specific areas such as LAN performance, traffic insights, and latency.
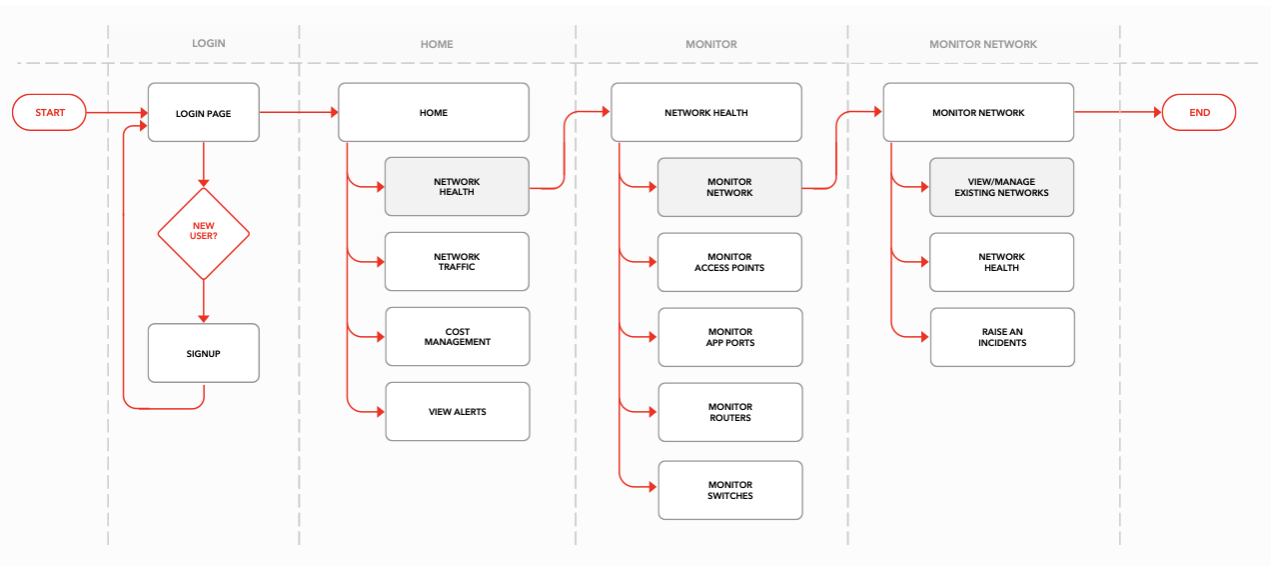
User Flow
In addition to task flows, we developed comprehensive user flows that represented the overall navigation through the ‘NetGuard’ platform. These user flows connected multiple tasks and showed how IT Managers would move between different sections of the platform, such as from monitoring network health to managing costs. The user flows were designed to ensure a seamless experience, allowing IT Managers to quickly find the information they need and take action without unnecessary clicks or navigation steps.
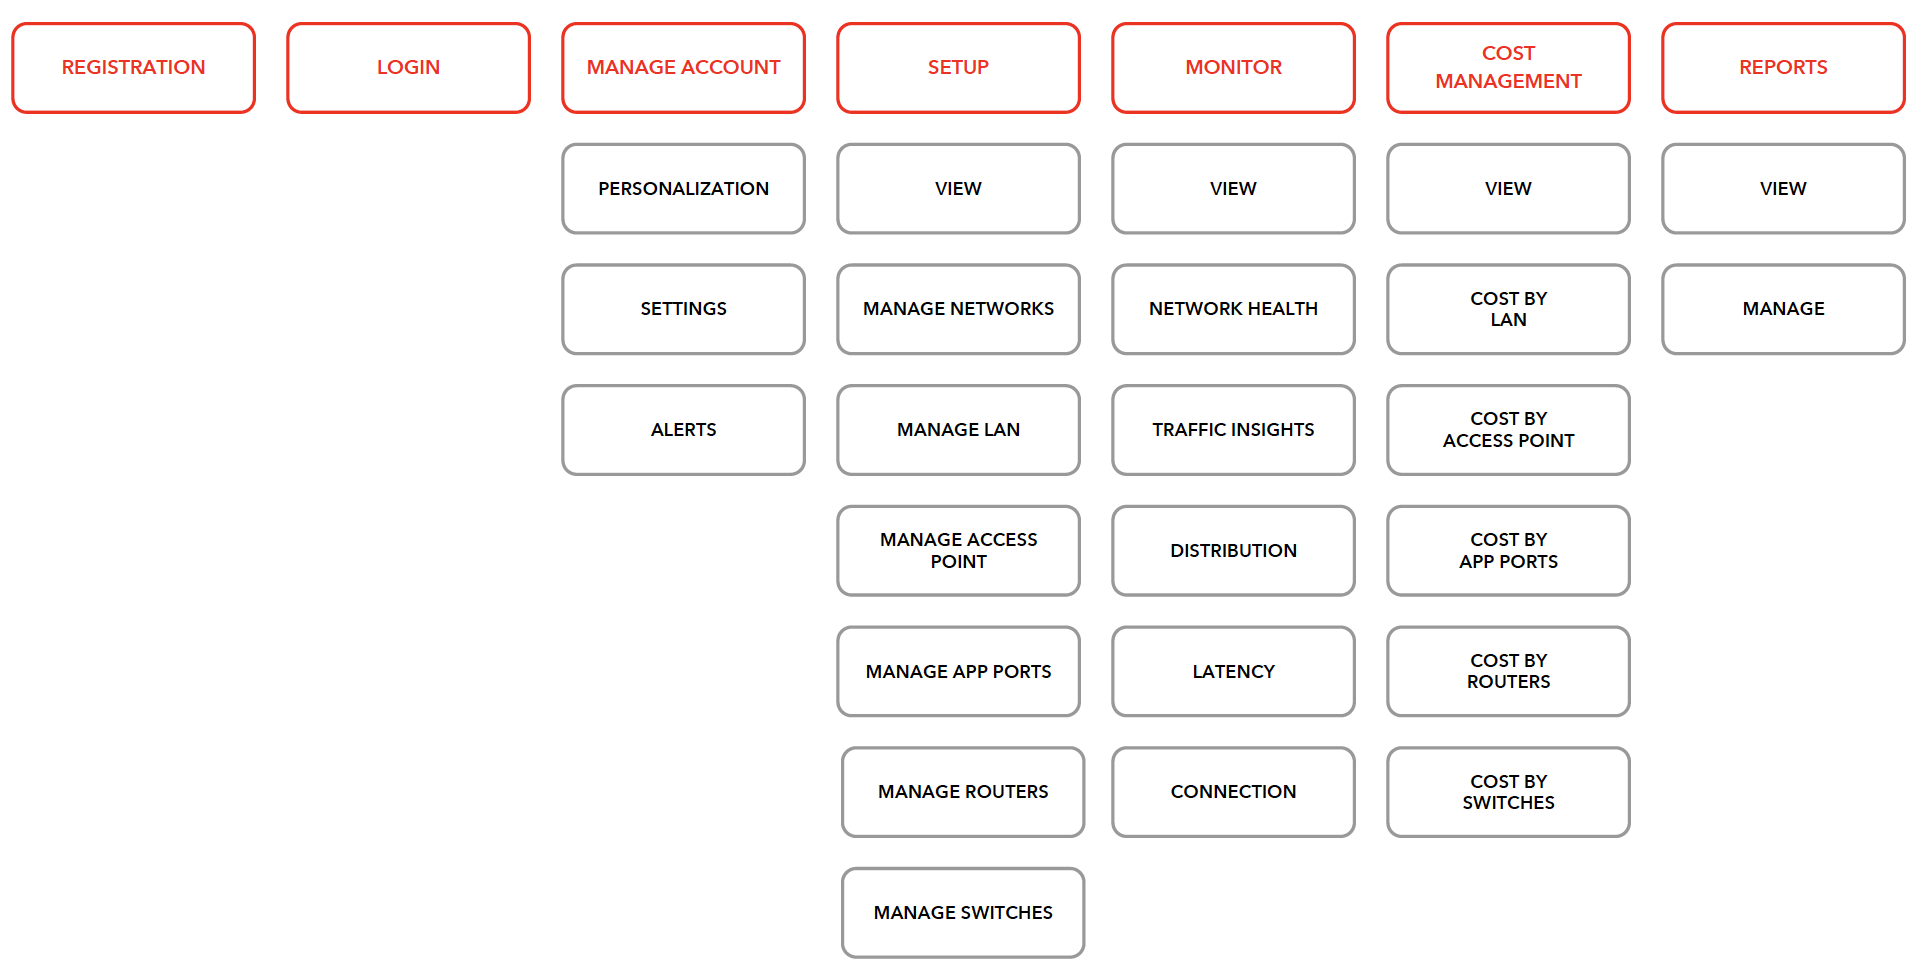
Information Architecture
The information architecture (IA) for ‘NetGuard’ was carefully structured to reflect the needs of the IT Managers and the complexity of the network management tasks. We organized the IA into logical categories and hierarchies, making it easy for users to locate different features and tools within the platform.
The main sections of the IA included:
- Dashboard: A central hub where IT Managers can view a summary of network health, key alerts, and important metrics.
- Network Management: A section dedicated to setting up and managing the network infrastructure, including LANs, routers, switches, and access points.
- Monitoring Tools: Tools for monitoring real-time network performance, traffic insights, and latency.
- Cost Management: A section focused on tracking and optimizing network-related expenses.
- Reports: Access to detailed reports on network performance, usage, and costs.
By defining the user tasks, task flows, user flows, and information architecture, we established a clear blueprint for the design and development of ‘NetGuard.’ This phase ensured that the platform would be structured in a way that aligns with the IT Manager’s workflow, making it both powerful and easy to use.
6. Ideation
The ideation phase of the ‘NetGuard’ project was a crucial step in transforming research insights and defined user needs into concrete design concepts. During this phase, we explored various solutions to address the challenges faced by IT Managers, with a focus on creating a user-centered, efficient, and scalable network management platform.
Brainstorming Solutions
With a clear understanding of the user tasks, flows, and information architecture, the team began the ideation process by brainstorming potential solutions. This collaborative effort involved cross-functional team members, including UX designers, the UX lead, developers, and product stakeholders. The goal was to generate a wide range of ideas that could address the key challenges identified in the research phase, such as simplifying network monitoring, optimizing cost management, and enabling mobility for IT Managers.
Key activities during the brainstorming sessions included:
- Sketching Initial Concepts: We started by sketching out rough ideas for the user interface, focusing on how the IT Manager would interact with the platform’s core features. These sketches helped visualize different ways to organize information, present data, and streamline user workflows.
- Exploring Interaction Models: We explored different interaction models that could make the platform intuitive and easy to navigate. This included considering various dashboard layouts, navigation structures, and ways to visualize complex network data.
- Prioritizing Features: Given the complexity of network management, we prioritized features that would deliver the most value to the user. We focused on creating a balanced design that offered robust functionality without overwhelming the user with unnecessary options.
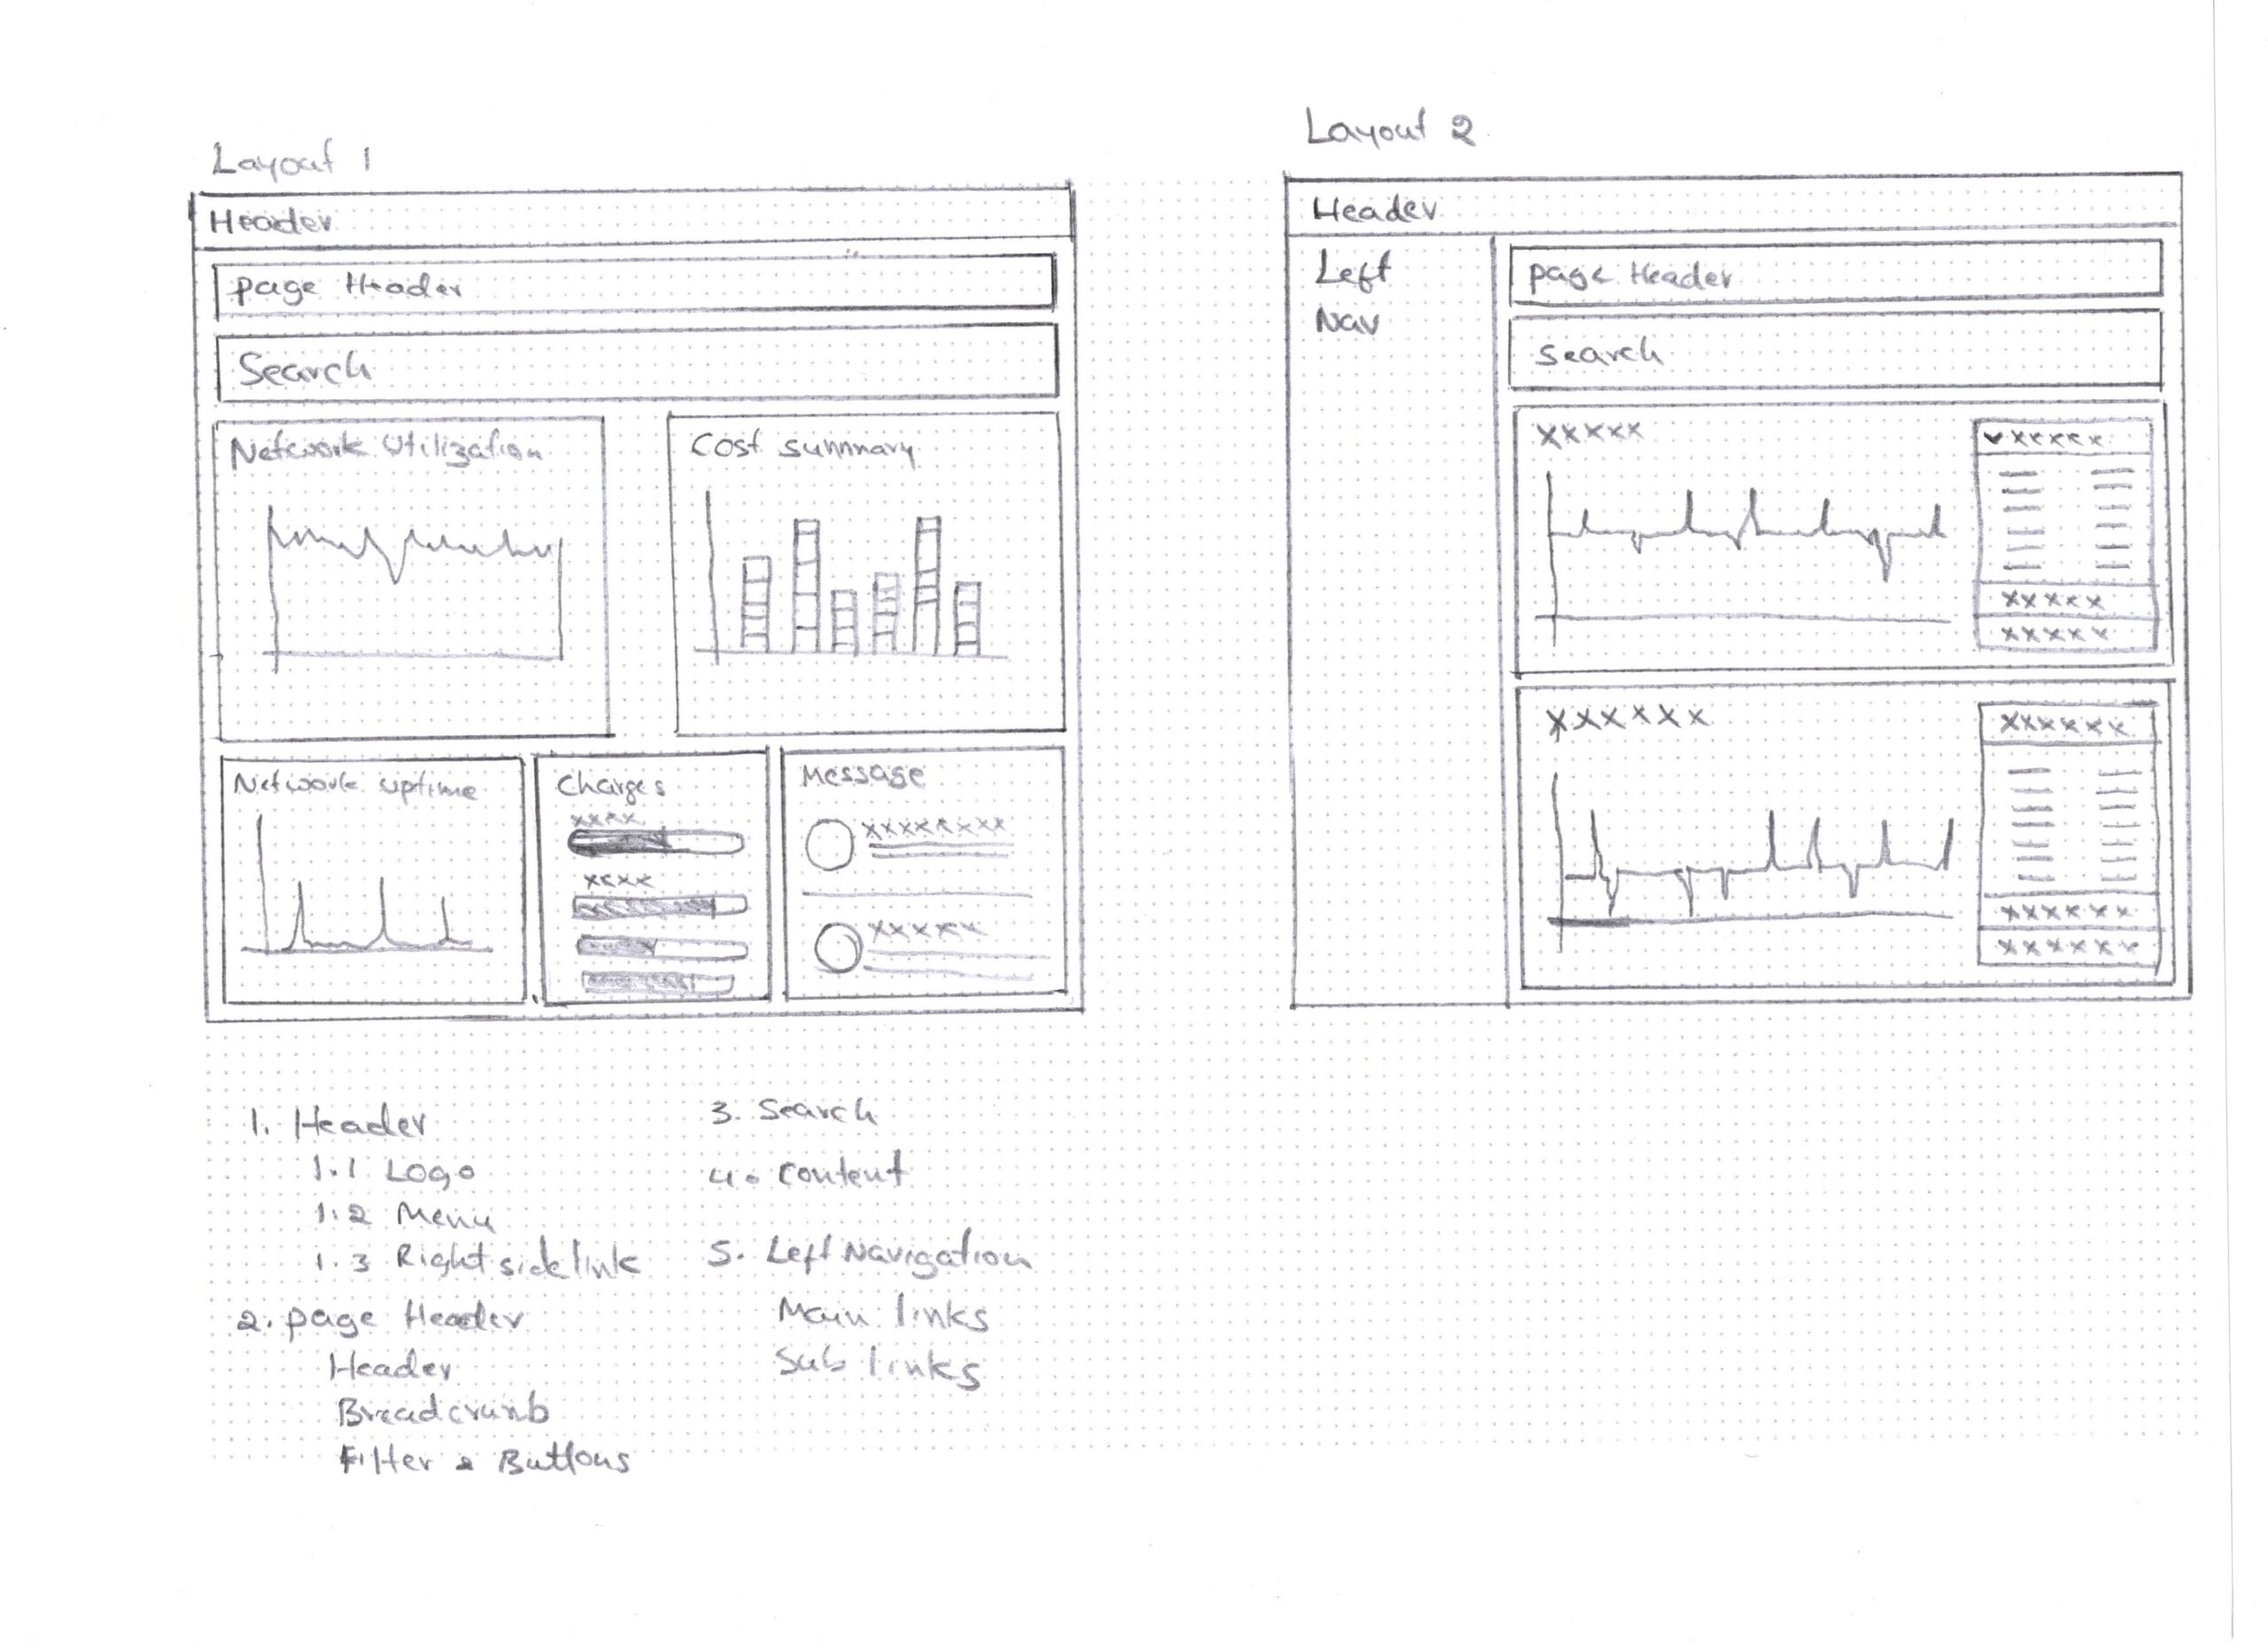
Low-Fidelity Wireframes
After narrowing down the most promising ideas from the brainstorming sessions, we began creating low-fidelity wireframes. These wireframes served as a blueprint for the overall layout and structure of the ‘NetGuard’ platform. They allowed us to quickly iterate on different design concepts and test how well they aligned with the user’s needs and tasks.
Key aspects of the low-fidelity wireframes included:
- Dashboard Layouts: We experimented with various dashboard layouts to determine the most effective way to present key network metrics, such as utilization, uptime, and costs. The goal was to create a dashboard that provided IT Managers with a quick and clear overview of network health at a glance.
- Navigation Structure: We designed and tested different navigation structures to ensure that IT Managers could easily access the tools and information they needed. This involved organizing the main sections of the platform, such as Network Management, Monitoring, and Cost Management, in a way that reflected the user’s workflow.
- Data Visualization: Given the importance of real-time network data, we explored different approaches to data visualization. The wireframes included initial concepts for graphs, charts, and alerts that would help IT Managers quickly interpret network performance and identify potential issues.
Integration with Design Process
Throughout the ideation phase, we maintained close collaboration with the UX lead, developers, and stakeholders to ensure that the proposed solutions were feasible and aligned with the project’s goals. Regular feedback sessions allowed us to refine the wireframes and ensure that the design was both user-centered and technically achievable.
We also integrated the ideation process with the overall design workflow, ensuring that the transition from low-fidelity wireframes to high-fidelity designs would be smooth. The ideation phase laid the groundwork for the detailed design work that followed, providing a solid foundation for creating a platform that was both functional and user-friendly.
By the end of the ideation phase, we had developed a set of low-fidelity wireframes that captured the core concepts for ‘NetGuard.’ These wireframes were ready to be tested and iterated upon, leading into the next phase of the project: detailed design and prototyping.
7. Design
The design phase of the ‘NetGuard’ project was dedicated to transforming the concepts generated during ideation into a fully realized user interface. This phase involved creating high-fidelity wireframes, developing interactive prototypes, and iterating on the design based on feedback from usability testing. The goal was to ensure that ‘NetGuard’ not only met the functional requirements but also provided an intuitive and seamless user experience.
High-Fidelity Wireframes
Building on the low-fidelity wireframes developed during the ideation phase, we created high-fidelity wireframes that detailed the visual design and interaction elements of ‘NetGuard.’ These wireframes included precise layouts, typography, color schemes, and visual hierarchy, reflecting the brand’s identity and the needs of the IT Managers who would be using the platform.
Key aspects of the high-fidelity wireframes included:
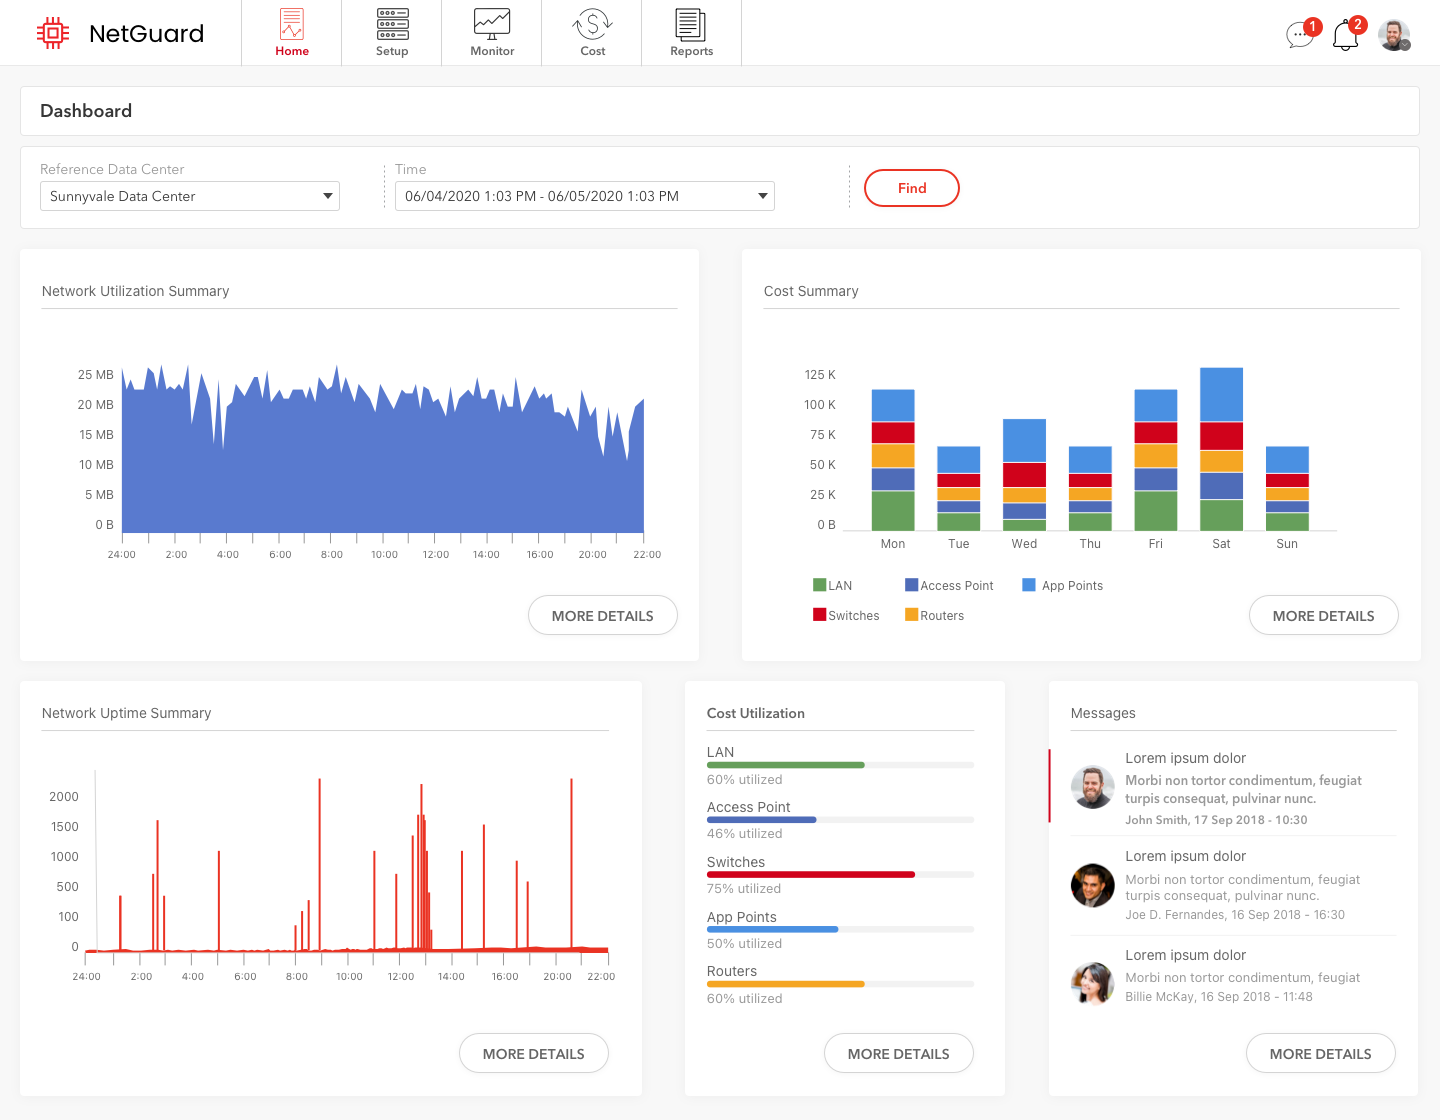
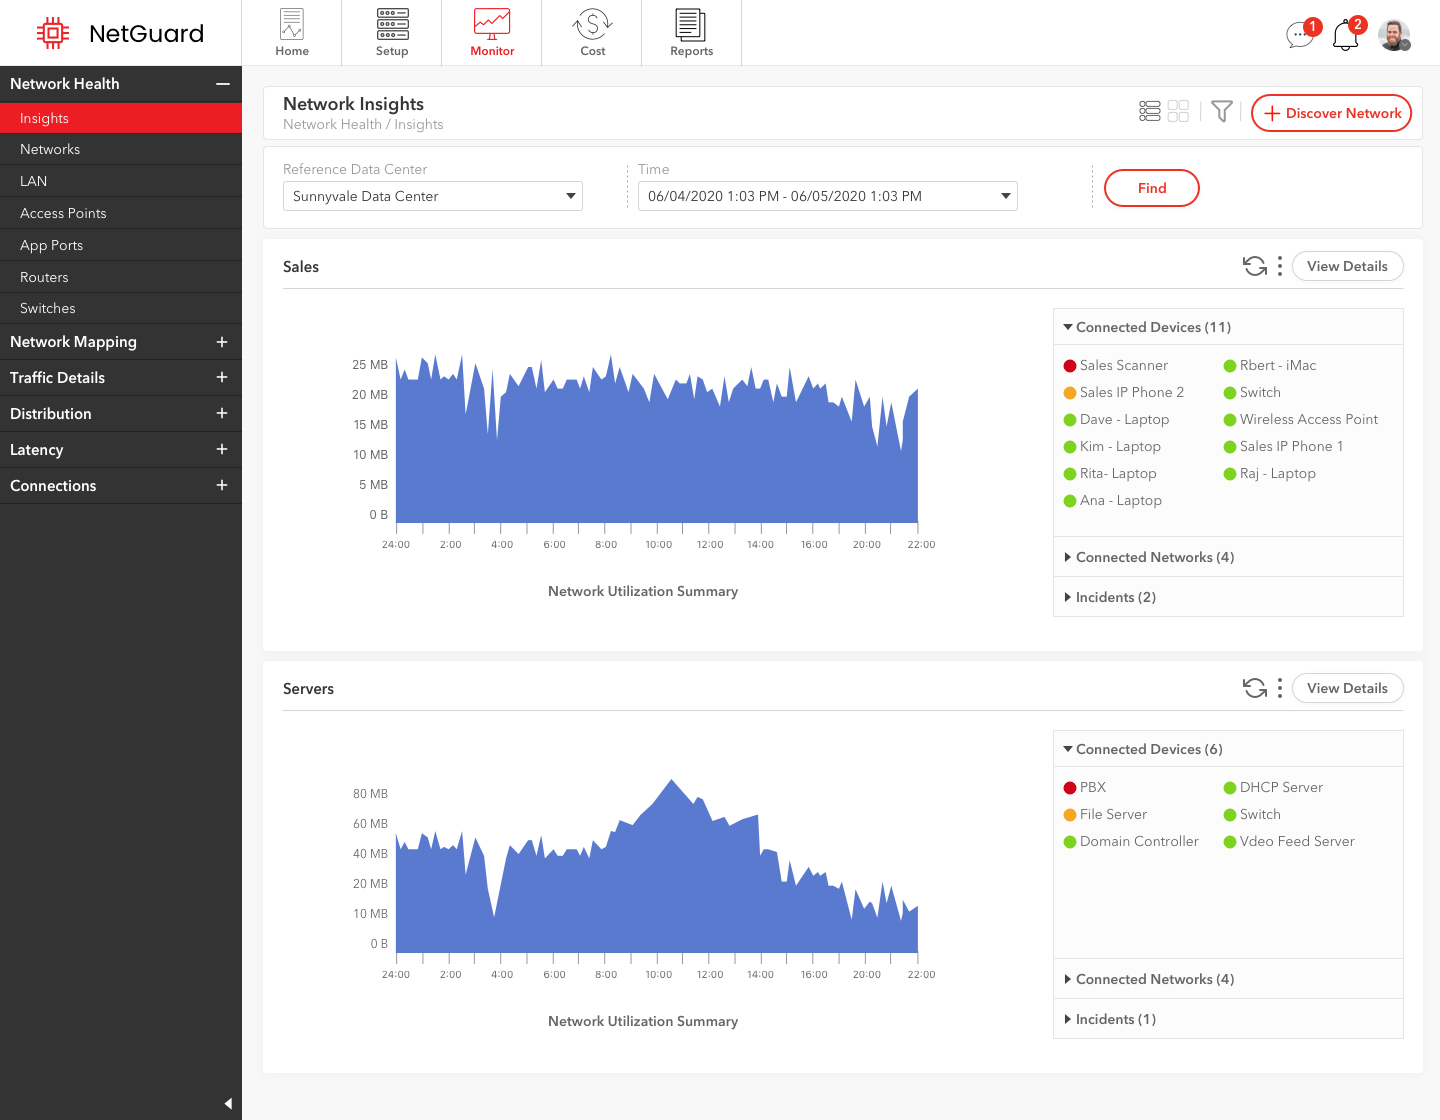
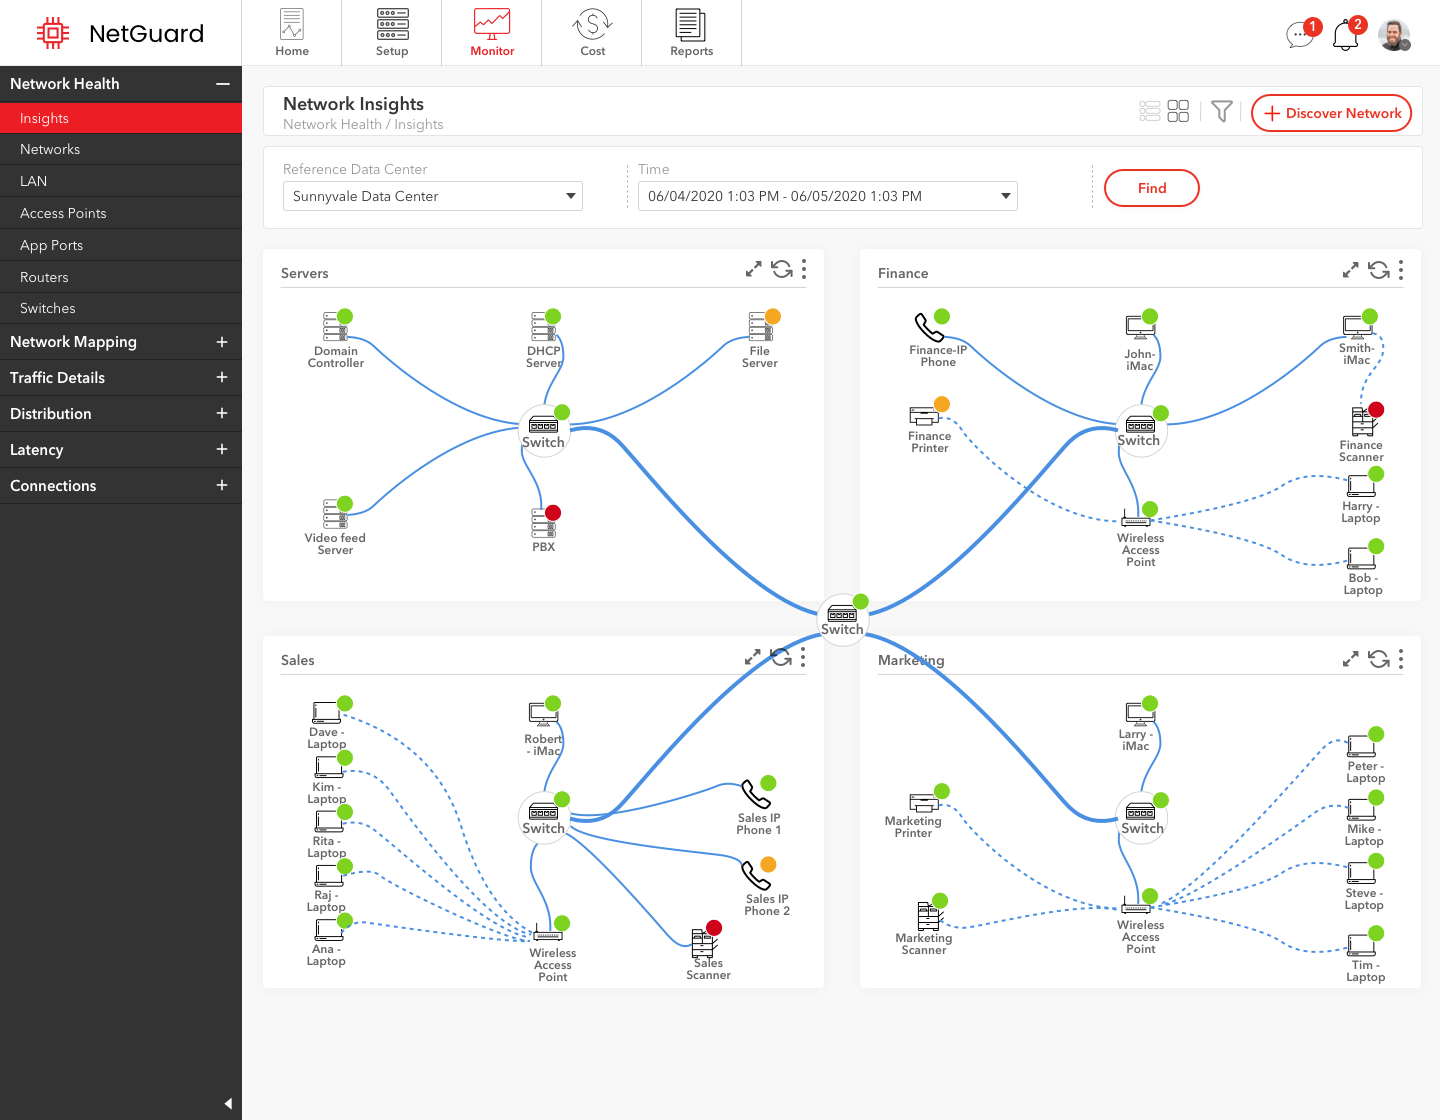
- Dashboard Design: The dashboard was designed to be the central hub of the ‘NetGuard’ platform, offering IT Managers a quick overview of network health, key metrics, and alerts. We focused on creating a clean and organized layout that prioritized the most critical information while allowing users to easily access more detailed views when needed.
- Data Visualization: Given the importance of real-time data in network management, we designed various data visualizations, such as graphs, charts, and heat maps, to represent network utilization, latency, and costs. These visualizations were designed to be easily interpretable, enabling IT Managers to quickly assess the state of their networks and make informed decisions.
- Navigation System: The navigation system was designed to be intuitive and accessible, with a clear hierarchy that reflected the user’s workflow. We incorporated a combination of global and contextual navigation elements to ensure that IT Managers could easily switch between different tasks, such as monitoring network performance, managing costs, and responding to incidents.
Prototyping
With the high-fidelity wireframes in place, we developed an interactive prototype that allowed stakeholders and users to experience the ‘NetGuard’ platform as it would function in a real-world setting. The prototype included key user flows, such as logging in, navigating the dashboard, monitoring network health, and managing costs.
Key features of the prototype included:
- Interactive Dashboard: The prototype featured a fully interactive dashboard that allowed users to explore different metrics and data visualizations. Users could click on different elements to access more detailed information, such as network performance over time or cost breakdowns by component.
- Responsive Design: We ensured that the prototype was responsive, allowing IT Managers to interact with the platform on various devices, including desktops, tablets, and mobile phones. This was particularly important given the need for IT Managers to access ‘NetGuard’ while on the move.
- Realistic User Scenarios: The prototype was designed to simulate realistic user scenarios, such as responding to a network alert or generating a cost report. These scenarios helped to validate the user flows and ensure that the design supported the IT Manager’s tasks effectively.
Design Iterations
After creating the prototype, we conducted usability testing sessions with actual IT Managers to gather feedback on the design. The testing provided valuable insights into how users interacted with the platform, what aspects worked well, and where improvements were needed.
Based on the feedback from usability testing, we made several iterations to the design:
- Refining Data Visualizations: Some users found certain data visualizations to be complex or difficult to interpret. We simplified these visualizations, focusing on clarity and ease of understanding, while ensuring that they still provided the necessary insights.
- Improving Navigation: Feedback indicated that some users had difficulty navigating between different sections of the platform. We made adjustments to the navigation structure, adding more prominent visual cues and improving the flow between related tasks.
- Enhancing Mobile Usability: Although the platform was designed to be responsive, usability testing revealed that certain interactions were less intuitive on mobile devices. We optimized the design for smaller screens, ensuring that all features were easily accessible and usable on mobile devices.
Through these iterations, we refined the design to better meet the needs of the IT Managers, ensuring that ‘NetGuard’ was both powerful and user-friendly.
8. Testing
The testing phase of the ‘NetGuard’ project was crucial for validating the design and ensuring that it met the needs of IT Managers in real-world scenarios. During this phase, we conducted usability testing sessions to gather feedback on the interactive prototype, identify potential issues, and refine the design based on user insights.
Usability Testing
To evaluate the effectiveness and usability of the ‘NetGuard’ platform, we conducted a series of usability testing sessions with a group of IT Managers who represented our target users. These sessions were designed to observe how users interacted with the prototype, understand their thought processes, and identify any pain points or areas of confusion.
Key components of the usability testing included:
- Test Scenarios: We developed realistic scenarios that reflected common tasks IT Managers would perform using ‘NetGuard.’ These scenarios included actions such as monitoring network health, responding to alerts, and analyzing cost reports. By guiding users through these scenarios, we were able to observe how they navigated the platform and whether the design supported their workflow.
- Task Completion: During the sessions, users were asked to complete specific tasks within the prototype, such as finding a specific network issue or generating a cost analysis report. We measured task completion rates, time on task, and the number of errors or difficulties encountered. This data provided quantitative insights into the usability of the platform.
- User Feedback: In addition to observing user interactions, we gathered qualitative feedback through think-aloud protocols and post-test interviews. Users were encouraged to verbalize their thoughts as they interacted with the prototype, allowing us to capture their initial impressions, frustrations, and suggestions for improvement. The post-test interviews provided deeper insights into their overall experience and specific design elements that worked well or needed refinement.
Iteration Based on Feedback
The insights gained from usability testing were invaluable in refining the design of ‘NetGuard.’ Based on the feedback from users, we made several key improvements to the platform:
- Simplifying Navigation: Some users found the navigation between different sections of the platform to be less intuitive than expected. In response, we streamlined the navigation structure, making it easier for users to switch between tasks and find the information they needed quickly. We also added visual cues and labels to guide users through the platform.
- Enhancing Data Visualization: Feedback indicated that certain data visualizations were too complex or not immediately clear to all users. To address this, we refined the visual design of charts, graphs, and other data elements, focusing on clarity and ease of interpretation. We also provided tooltips and hover states to give users additional context when interacting with data.
- Improving Mobile Usability: While the platform was designed to be responsive, usability testing revealed that some interactions were more cumbersome on mobile devices. We optimized the design for smaller screens by simplifying touch targets, adjusting layout elements, and ensuring that all key features were easily accessible on mobile.
- Optimizing Workflow Efficiency: Some users expressed a desire for quicker access to critical features, such as incident management and network monitoring. In response, we adjusted the workflow to prioritize these features on the dashboard and streamline the steps required to complete these tasks.
Final Testing and Validation
After implementing the changes from the initial usability testing sessions, we conducted a final round of testing to validate the improvements. This round confirmed that the adjustments made to navigation, data visualization, and mobile usability significantly enhanced the user experience. Users reported greater satisfaction with the platform’s ease of use, clarity of information, and overall efficiency.
By rigorously testing and iterating on the design, we ensured that ‘NetGuard’ not only met but exceeded the expectations of IT Managers. The testing phase was instrumental in refining the platform and delivering a product that is both powerful and user-friendly.
9. Challenges Faced and Solutions
Throughout the design and development of ‘NetGuard,’ we encountered several challenges that required thoughtful problem-solving and innovative solutions. These challenges were integral to shaping the final product, as overcoming them ensured that ‘NetGuard’ would meet the needs of IT Managers effectively and provide a seamless user experience.
Challenge 1: Complexity of Network Data Visualization
The Challenge: Presenting complex network data in a clear, easy-to-understand way was difficult due to the vast amount of metrics involved.
The Solution: We used hierarchical data display, interactive elements, and color coding to simplify the data and make it more accessible to users.
Challenge 2: Balancing Feature Richness with Usability
The Challenge: Offering many features without overwhelming users was a balancing act, as the platform needed to be powerful but intuitive.
The Solution: We prioritized core features, used a modular design approach for customization, and implemented progressive disclosure to simplify the interface.
Challenge 3: Ensuring Mobile Usability
The Challenge: Designing for mobile devices while maintaining full functionality posed challenges due to screen size and interaction differences.
The Solution: We ensured a responsive design, optimized touch interactions, and prioritized essential features for mobile use.
Challenge 4: Integrating Real-Time Data
The Challenge: Displaying real-time data accurately and without performance issues was a technical and design challenge.
The Solution: We optimized data handling, integrated live data visualizations, and conducted extensive testing to ensure performance and accuracy.